
-
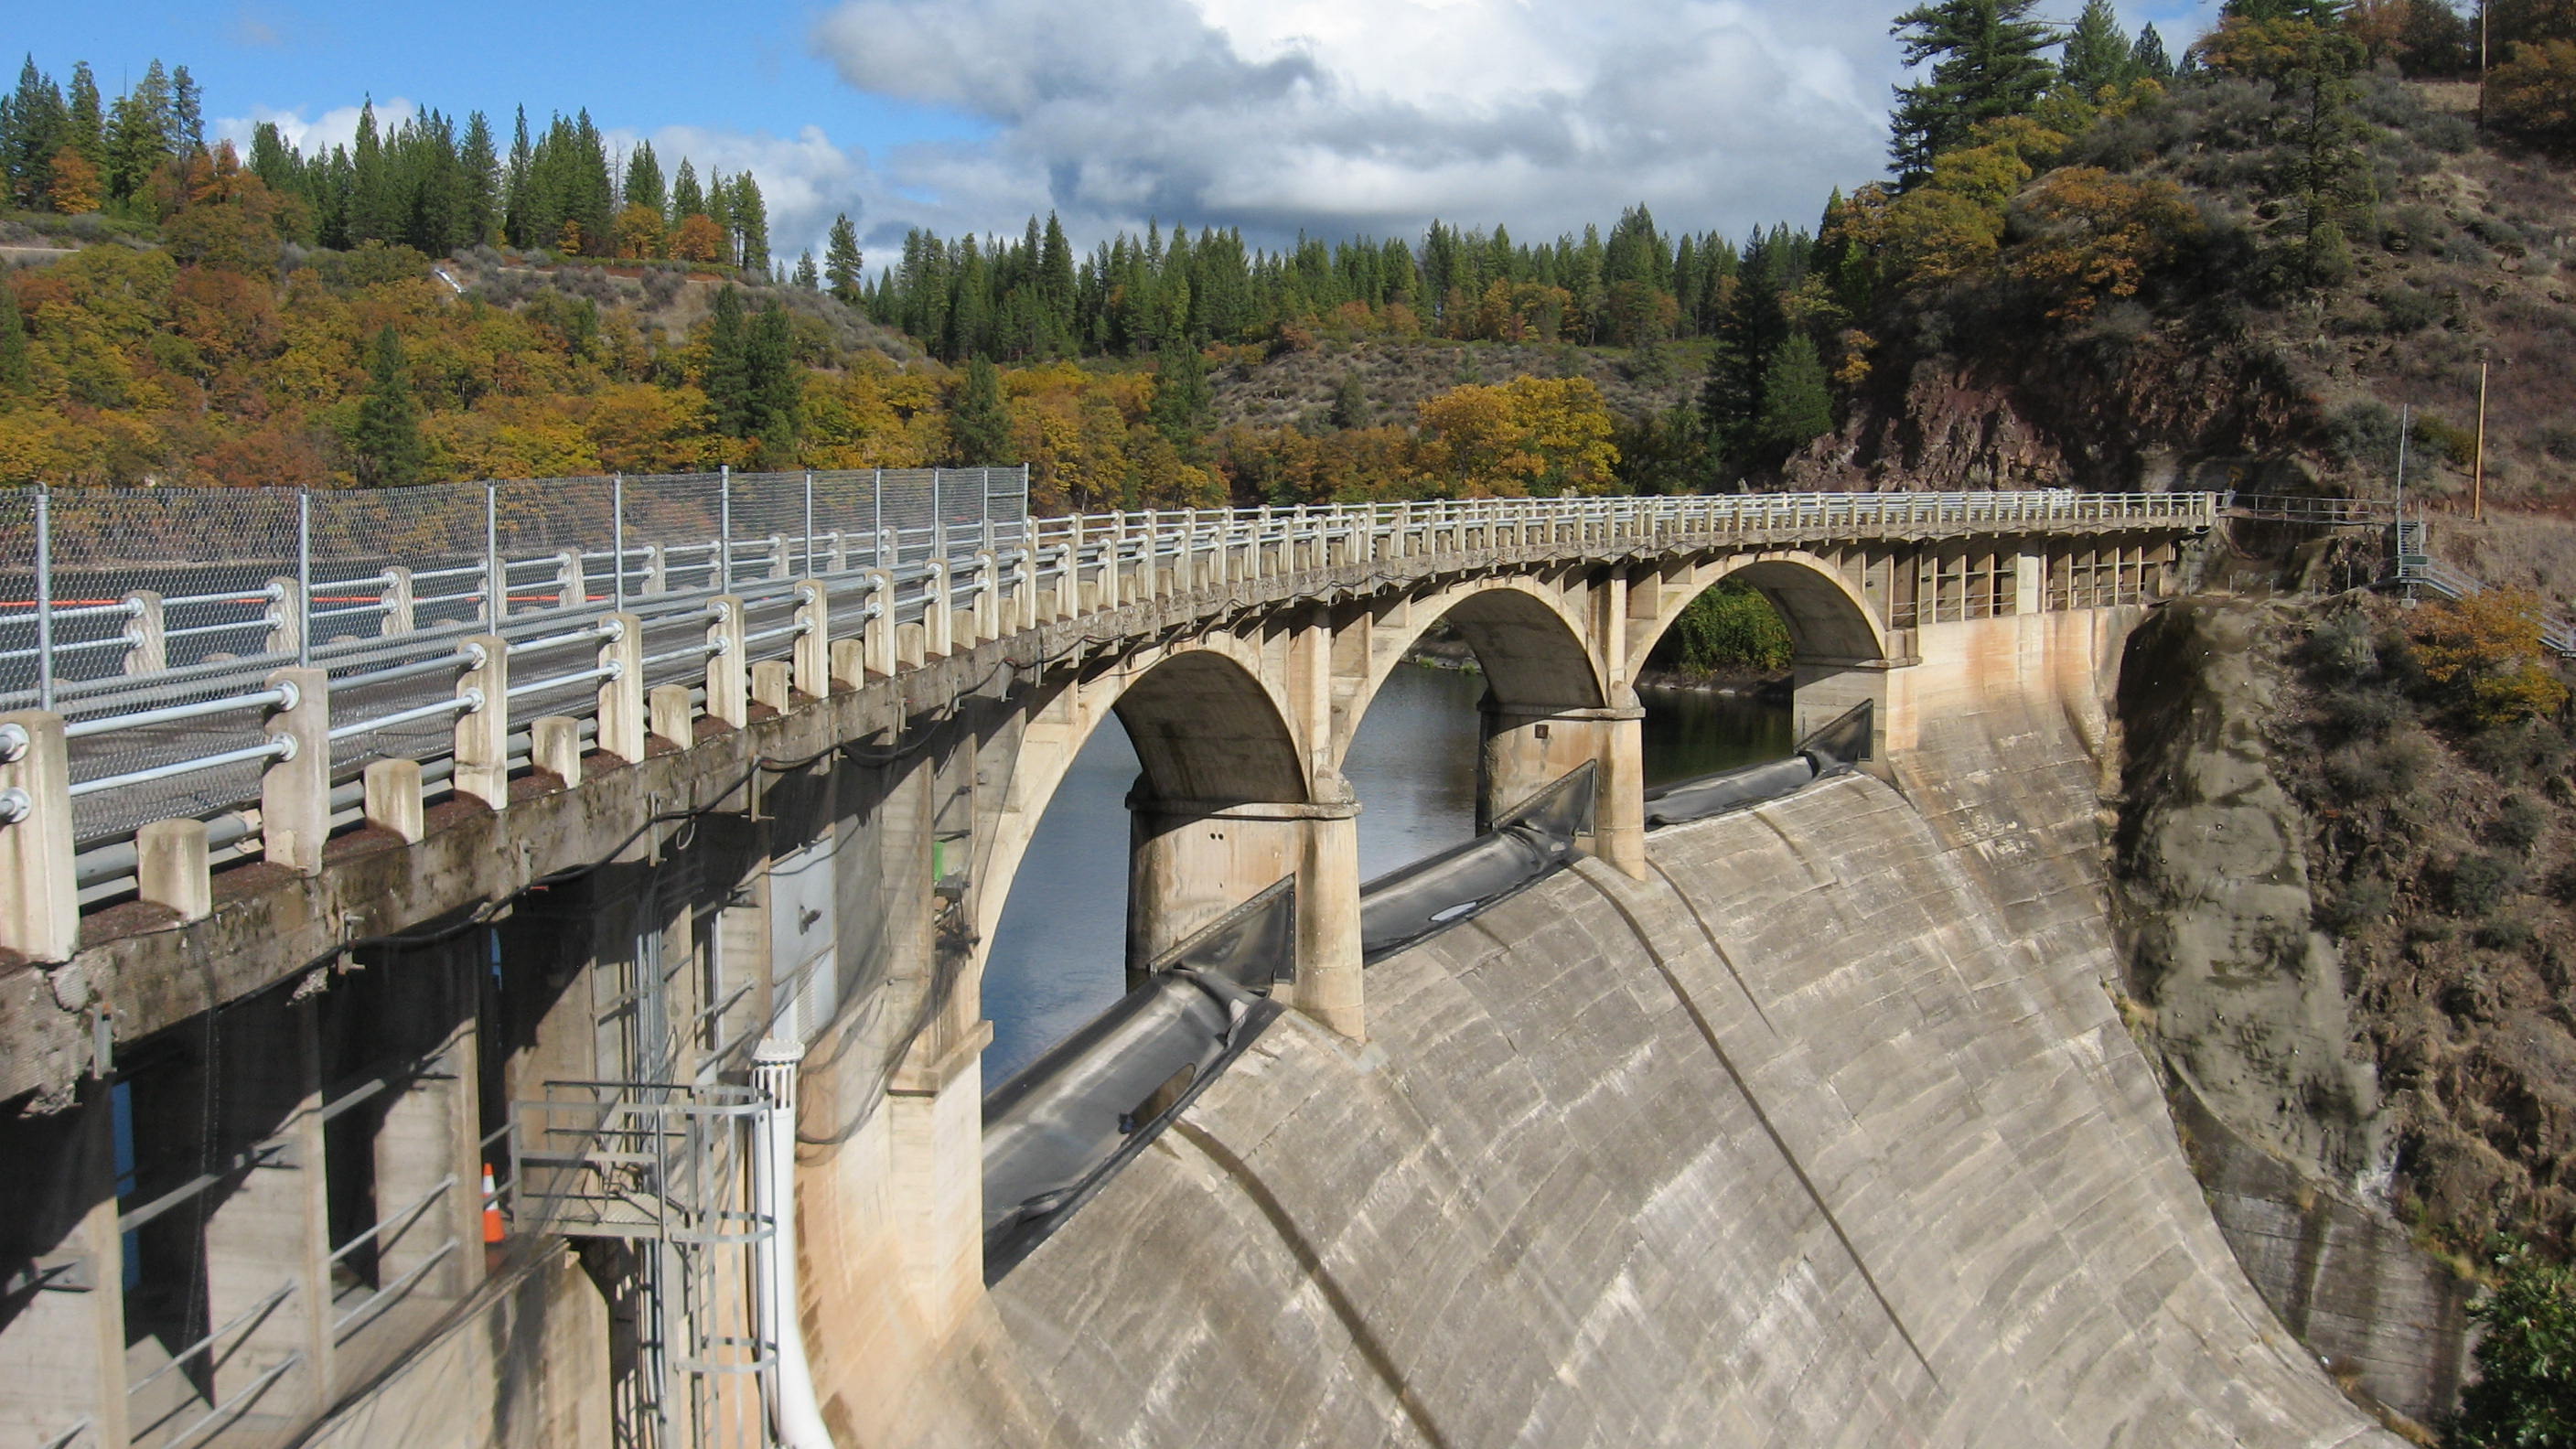
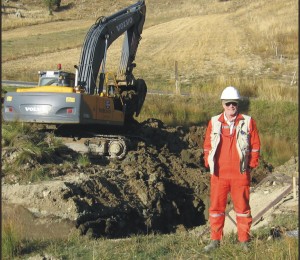
A dam over the Pit River in northern California
Figure 1. The Pit River hydroelectric system is a major source of renewable power for northern California.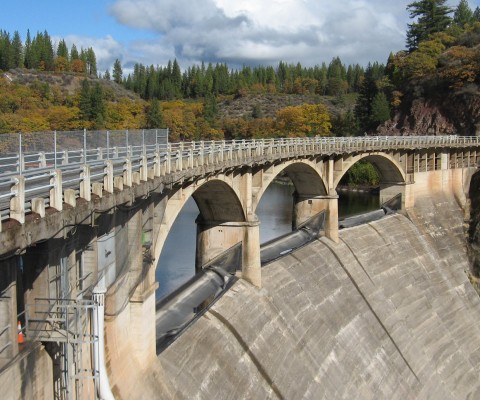
Figure 1. The Pit River hydroelectric system is a major source of renewable power for northern California.
-
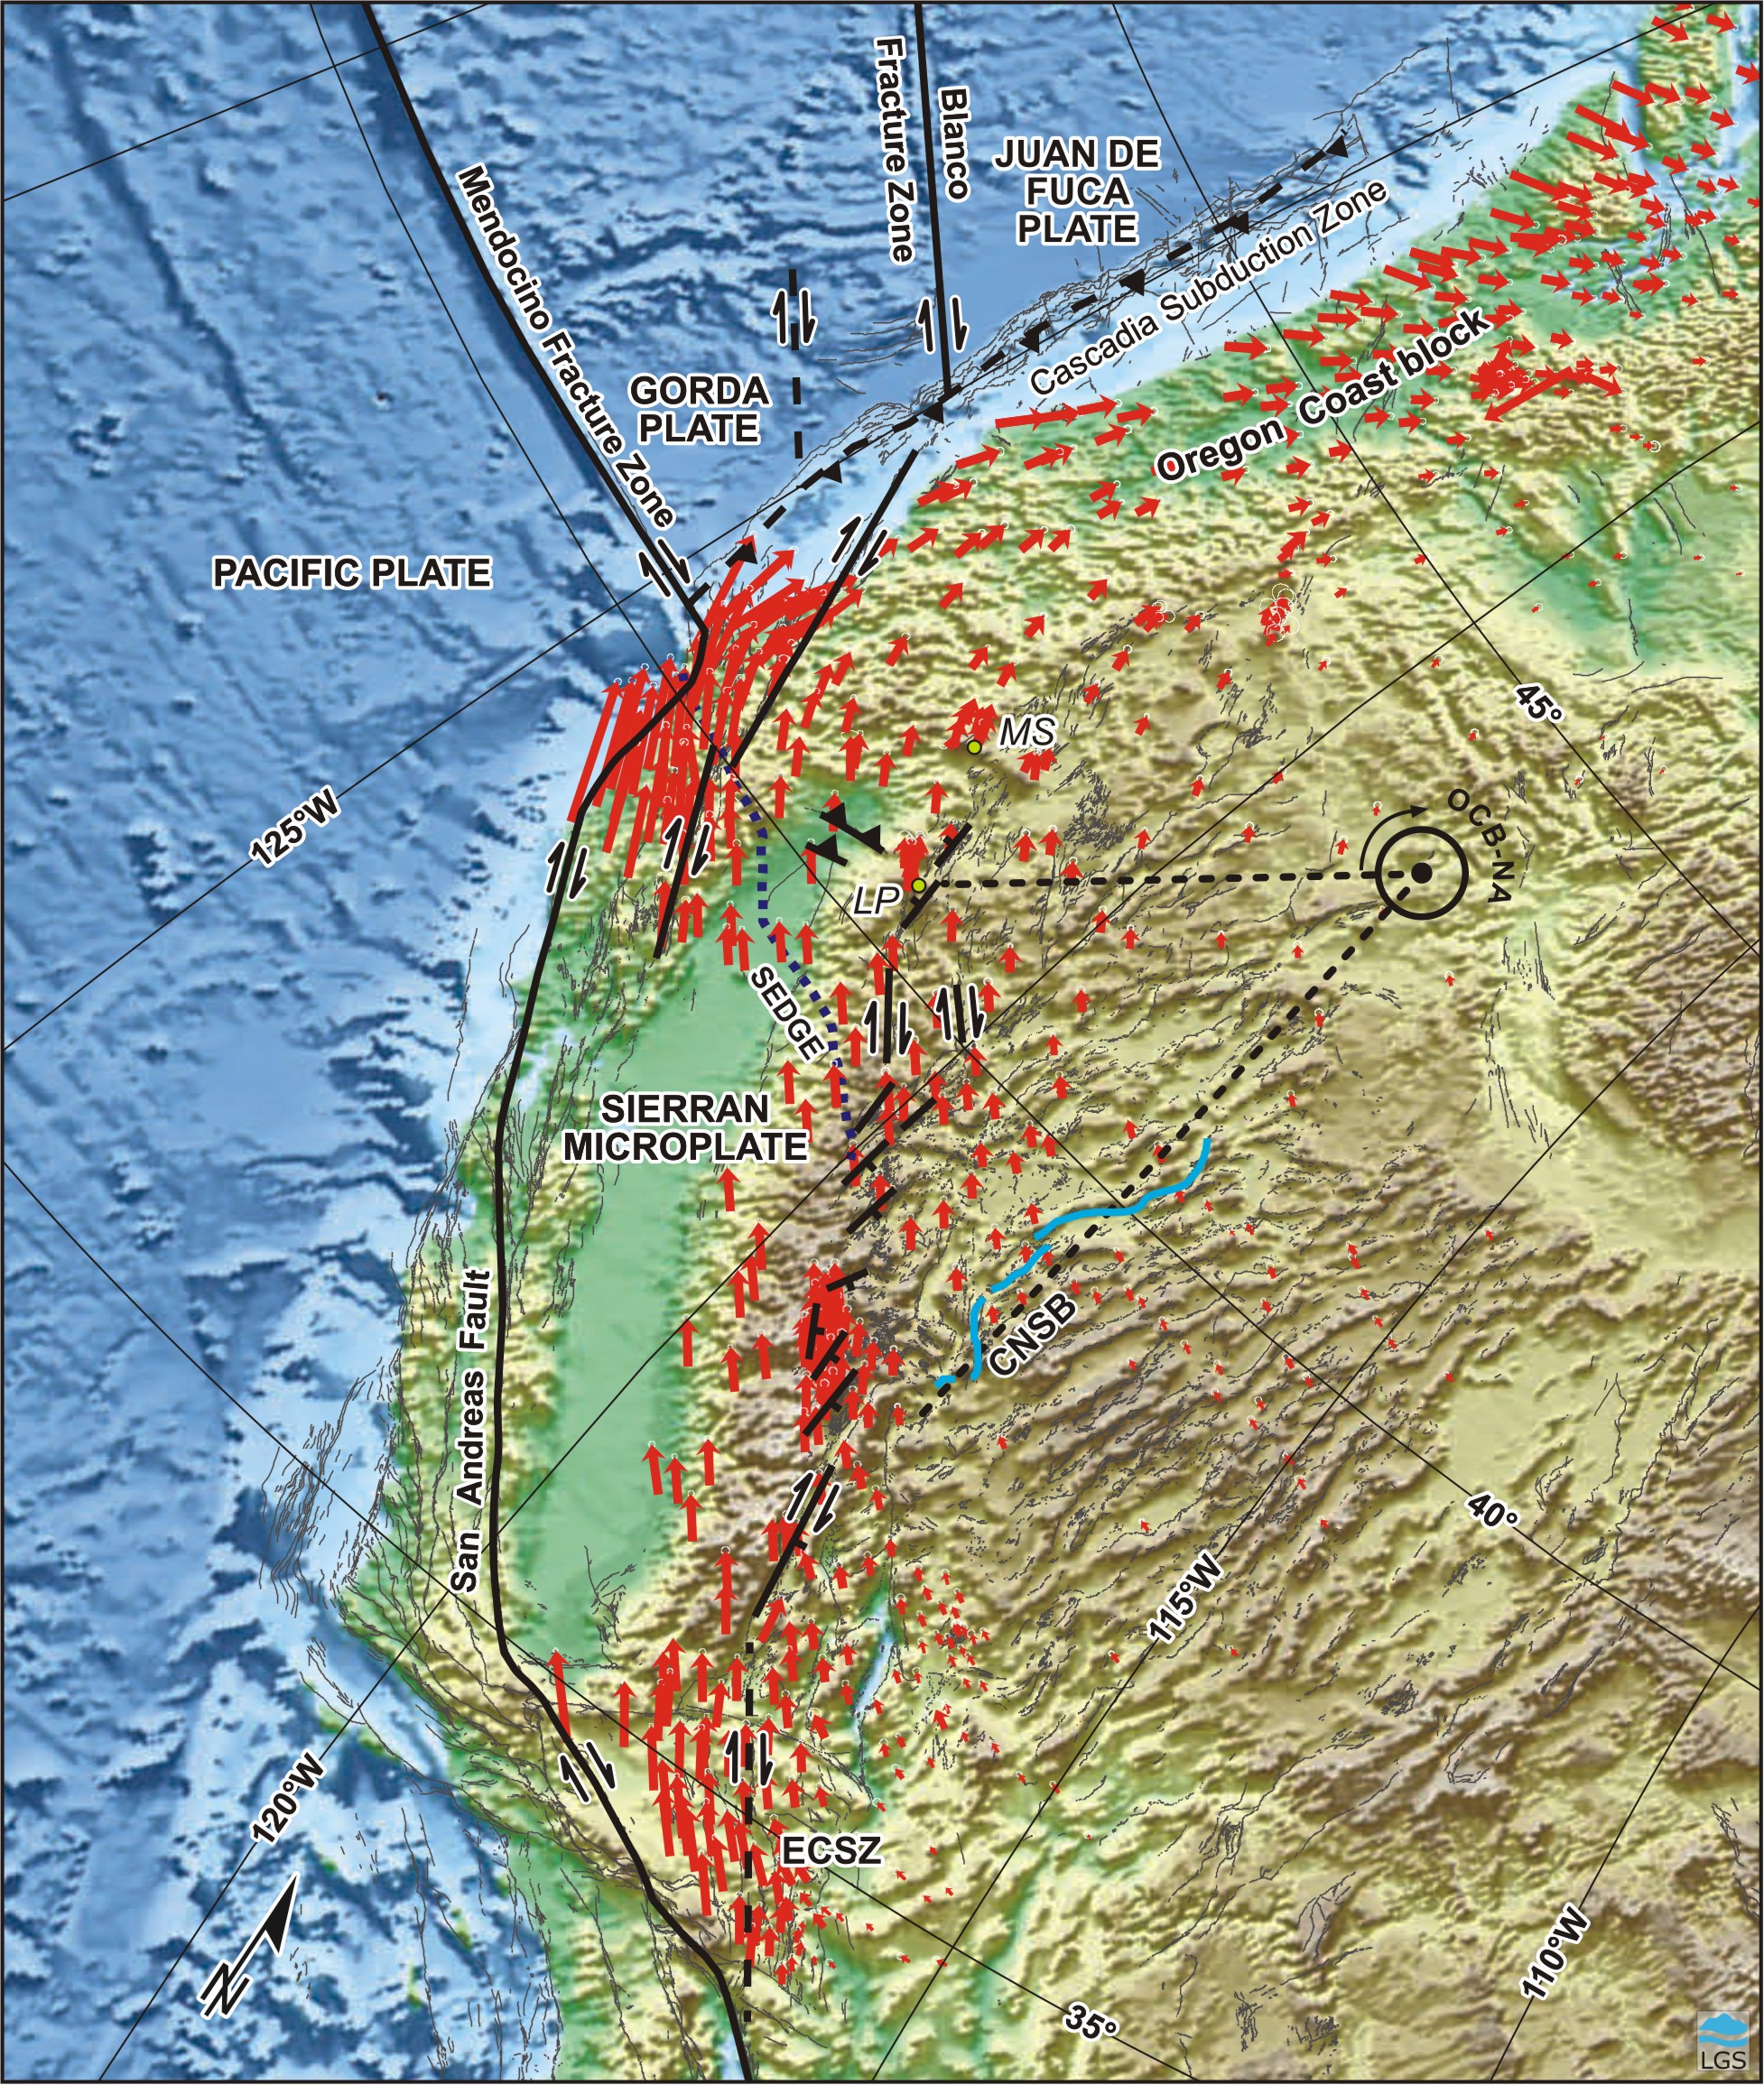
Western Cordillera GPS Velocity Vectors
Figure 2. Western Cordillera GPS velocity vectors (red arrows) relative to stable North America overlain on an oblique Mercator projection about the Sierra Nevada-North America Euler pole.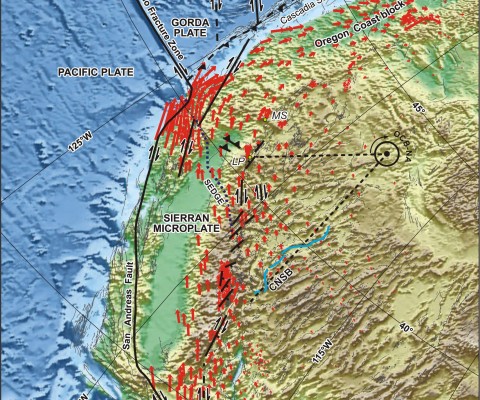
Figure 2. Western Cordillera GPS velocity vectors (red arrows) relative to stable North America overlain on an oblique Mercator projection about the Sierra Nevada-North America Euler pole.
-
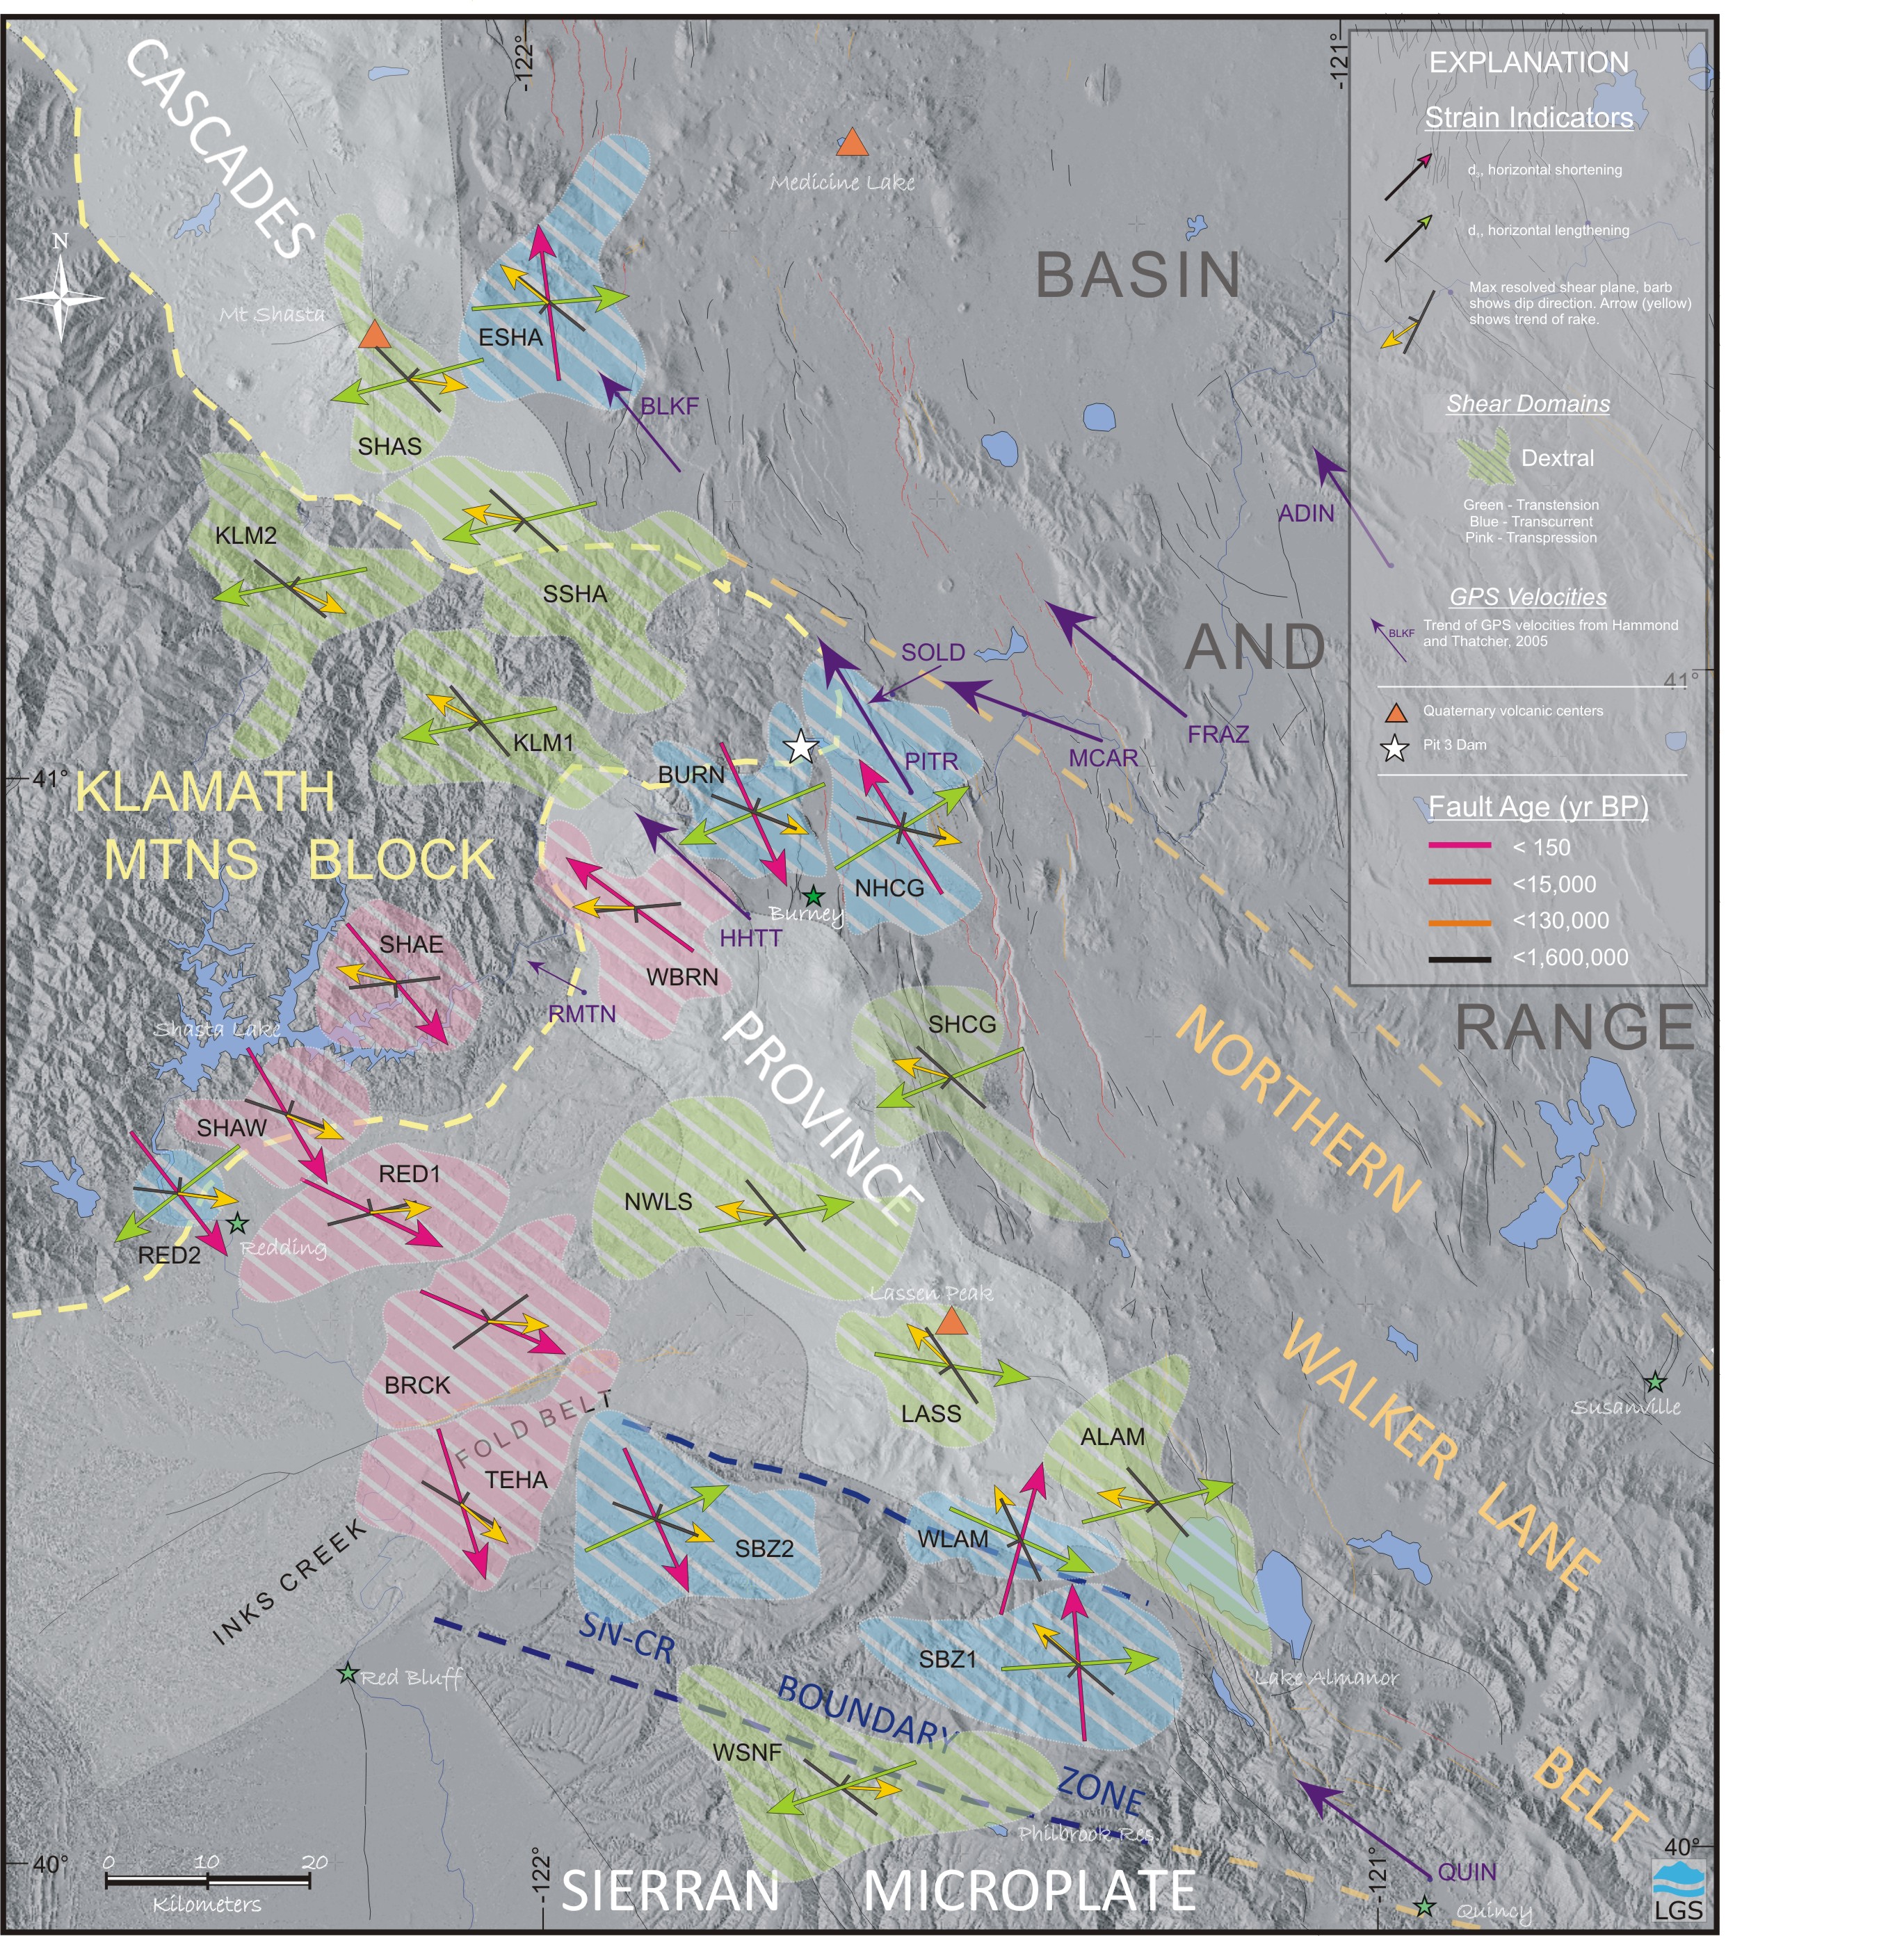
Seismotectonic Setting of Northern California
Figure 3. Results of the kinematic inversion of strain rate axes derived from earthquake focal mechanisms showing the different shear domains in northern California.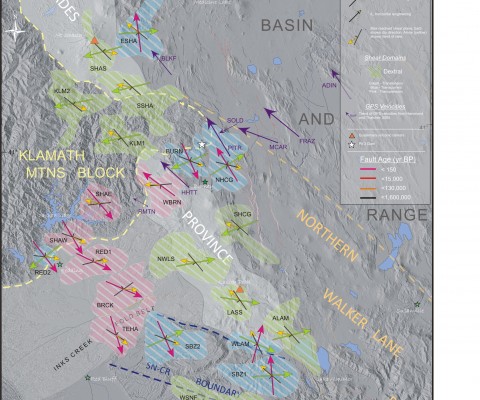
Figure 3. Results of the kinematic inversion of strain rate axes derived from earthquake focal mechanisms showing the different shear domains in northern California.
-
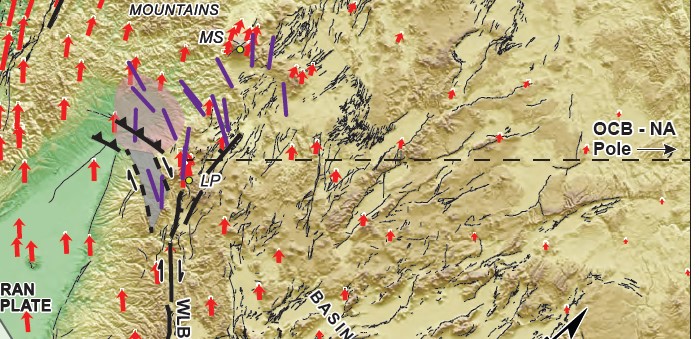
Orientation of Macroscopic Dextral Shear in Northern California
Figure 4. The orientation of maximum horizontal dextral shear from focal mechanism inversions is shown as the purple bars in this oblique Mercator projection around the Sierra Nevada-North America pole of rotation.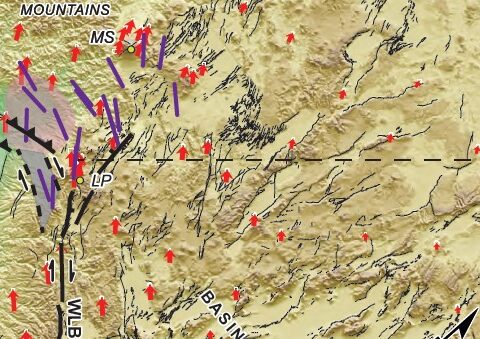
Figure 4. The orientation of maximum horizontal dextral shear from focal mechanism inversions is shown as the purple bars in this oblique Mercator projection around the Sierra Nevada-North America pole of rotation.
Project Overview
A seismotectonic analysis of northern California was conducted by LGS to provide insight into the regional tectonics that drive seismogenic deformation in the Pit River region. The Pit River is a major source of renewable hydroelectric power and the economic future of California depends on the seismic stability of its power generation infrastructure (Figure 1). The project goal was to characterize the deformation in this region near the intersection of several tectonic provinces: the southern Cascades, the northern Walker Lane, the western Modoc Plateau and the eastern Klamath Mountains. How the strain is accommodated between and within these provinces has implications for seismic hazard assessments of hydroelectric infrastructure along the Pit River. The characterization of seismogenic deformation provides a real-time picture of how tectonic strain is accommodated among the many faults in this complex region. Distinguishing active structures from pre-existing but no longer active faults will permit a kinematic model of deformation to be developed that can be incorporated with ongoing geological studies in the region.
Tectonic Setting
Earthquake activity in northern California reflects the large-scale interaction between the Pacific, North American, Gorda and Juan de Fuca plates. Northward migration of the Mendocino triple junction (MTJ), which separates the Pacific, North American and Gorda plates, lengthens the San Andreas fault system to the northwest as it accommodates Pacific-North America motion. Within this wide right-slip system geodetic studies have established that the Sierra Nevada and the Great Valley move as an independent microplate (the Sierran microplate) northwest relative to stable North America (Argus and Gordon, 1991; Wernicke and Snow, 1998). In Figure 2 Global Positioning System (GPS) velocity vectors relative to stable North America are shown as red arrows in an oblique Mercator projection about the Sierra Nevada-North America (SN-NA) Euler pole. Vertical arrows indicate GPS sites that move parallel to the Sierran microplate. Crustal velocities in Northern California, Oregon and Washington move clockwise of the SN-NA vectors around the Oregon Coast block-NorthAmerica Euler pole (OCB-NA). The Central Nevada Seismic Belt (CNSB, blue lines) delineates the clockwise change in rotation from east-west extension in the eastern Basin and Range to northwest-southeast extension between the CNSB and the northern terminus of the Walker Lane belt. Some of the abbreviations in the figure are: MS – Mt. Shasta, LP – Lassen Peak, SEDGE – southern edge of subducted Gorda plate (Liu et al., 2011). Many GPS vectors along coastal California are not shown to enhance clarity in the figure. The geodetic data is taken from the USGS at http://earthquake.usgs.gov/monitoring/gps/.
Technical Approach
Focal mechanisms from earthquakes in northern California formed the dataset used in characterizing the deformation. To provide an accurate depiction of the mode of fault failure focal mechanisms require well-determined earthquake locations. As a starting point a catalog of earthquakes was obtained from the Northern California Earthquake Data Center. In this analysis these earthquakes were relocated using the double-difference methodology of Waldhauser and Ellsworth (2000) and a 3-D tomographic model of the P-wave velocity structure in Northern California (Thurber et al., 2009) to provide precise hypocentral locations from which to calculate focal mechanisms. The P and T axes derived from the focal mechanisms were inverted for the components of a best-fit incremental deformation rate tensor using the automated grid search algorithm described in Twiss et al. (1993). The results of the inversion (orientations and relative magnitudes of the principal strain rates) can be interpreted directly in terms of how large volumes of the crust that contain the earthquakes are changing shape as a consequence of distributed seismogenic deformation.
Seismotectonic Analysis of Northern California
The results of the seismoteectonic analysis of northern California are shown in Figure 3 above. The subhorizontal extensional and shortening strain rates from inversion of the focal mechanisms are shown as green and magenta arrows, respectively, with the arrowhead in the direction of plunge. The strike of the plane of maximum resolved shear strain is shown as a line with a barb indicating direction of dip. Rake is shown as a yellow arrow. Colored shapes enclose the epicenters of events used in each inversion and indicate transpressional deformation (red), transtensional deformation (green) or transcurrent (blue) deformation. The pattern in the shapes indicates the interpreted sense of dextral shear (northwest slant). The GPS velocities from the Lassen network (Hammond and Thatcher, 2005) are shown as purple arrows scaled to the velocity at station QUIN (11.74 mm/yr, N52°W). The northern Walker Lane belt is characterized by transcurrent and transtensional deformation. Where dextral shear in the northern Walker Lane steps left across the Inks Creek fold belt (Unruh et al., 2003) transpression dominates. The portion of the Klamath Mtns block south of Mt. Shasta may be responding to north-south shortening as indicated by the Grizzly Peak anticline and the local deformation result for Soldier Mtn. The GPS velocities also suggest that contraction is localized in this northeast-trending belt that extends from west of Redding to MacArthur (MCAR). Transtensional or transcurrent deformation is taking place in the Shasta-Medicine Lake area to the north. The results of this analysis put into context the forces that load currently active faults by highlighting those that may be oriented in the strain field in such a way as to indicate the increased potential for slip. The kniematic inversion of focal mechanisms was conducted for LGS by Dr. Jeffrey Unruh of Lettis Consultants International.
Implications for the Interaction between the Sierran Microplate and the Oregon Coast Block
Both GPS geodesy and patterns of seismogenic deformation indicate that the transition from rigid west-northwest motion of the Sierran micoplate (SN) to rigid northwest motion of the Oregon Coast Block (OCB) occurs in a northeast-southwest-trending zone between Lassen Peak and Mt. Shasta (Figure 4). The orientation of maximum horizontal dextral shear from the focal mechanism inversions is shown as purple bars in Figure 4. These shear trends represent the motions of the Sierran microplate and the Oregon Coast block as they rotate about vertical axes. The trends of horizontal dextral shear fall into two general groups, northwest (parallel to SN-NA motion) and east-southeast (parallel to relative OCB-SN motion; McCaffery, 2009). In the figure the northwest-directed dextral shear appears vertical whereas the east-southeast trends are rotated counterclockwise from the SN-NA motion. The transition zone between the Sierran microplate and the Oregon Coast block is delineated by the two dashed lines that open about the OCB-NA Euler pole and in this zone the horizontal dextral shear trends rotate counterclockwise to accommodate the relative east-west motion between the two blocks. The Sierra Nevada – Cascade Range boundary zone transfers dextral shear across the northern Sierra to the northern Sacramento Valley where it drives shortening in the Inks Creek fold belt (Unruh, Humphrey and Barron, 2003).

- New Research on Northern California TectonicsJames Humphrey of LGS and Jeff Unruh of LCI have published a new paper on the tectonics driving defo...
 We’ve Moved!Lahontan GeoScience Has Moved! LGS has moved its office to a new location in south Reno....